
When you buy something through one of the links on our site, we may earn an affiliate commission.
Before you can grow your business, you need to know your numbers.
Simply adding more content to your blog or social media channels without knowing what works (and what doesn't) is a big waste of time and effort.
To know the right course of action, your engagement metrics will provide everything you need to achieve significant results.
In this post, we look at 19 engagement metrics to help you measure the performance of your content, so you can growth hack your way to success.
Let's dive in.
Contents
What Are Engagement Metrics?
Engagement metrics are a method used to measure the frequency of user impressions, interactions, and purchases of your content and products online.
Common types of metrics include:
- Impressions: The number of times a piece of content is displayed on a screen, whether it gets clicked or not
- Reach: The number of people who see your content
- Conversions: The number of times someone takes a desired action after viewing a piece of content (clicks a link in an email, becomes a subscriber, buys a product, etc.)
They are used as Key Performance Indicators or KPIs, providing insightful data behind what's working to grow your business.
Why Engagement Metrics Matter

Knowing the metrics behind user engagement is not only valuable but essential for business growth.
The more engagement your audience shows, the more likely they are to become customers.
Your metrics give you insight into how people interact with the content you publish.
Here are three benefits for tracking user engagement metrics.
1. Discover if people are consuming your content
When you track user engagement, you're able to see if your content is being consumed or not, enabling you to make necessary changes.
If you publish a lot of content, your metrics can reveal whether a lack of engagement is down due to an algorithm or interest in the content.
2. Know what content gets attention
When you know which content gets the most attention, you can ask yourself why.
By comparing popular content with underperforming content, you can understand your audience better and provide them with more of what they want.
Sometimes higher performing content comes down to design, the copy you use, or the topic. Analyzing which content does best helps you zone in on what works.
3. Make better business decisions
Sure, you can hire a team or agency who monitors your metrics and helps you growth hack more traffic, leads, and sales.
But if you're a one-person team, knowing your metrics is essential. When you wear all the hats in your business, you need to know how to make the right decisions.
Then, if you want to pay a VA to do some of this work, you'll at least know which metrics are important and understand your VA's suggestions.
Essential Engagement Metrics for Your Website or Blog
In this group of metrics, we'll look at the most essential things to measure on your website and blog.
Sessions
Sessions are the total number of visits your website gets in a chosen timeframe.
This shouldn't be mistaken with visitors or the number of people who visit your site, because the same people can visit your website multiple times and be counted as separate sessions.
Google Analytics 4 counts a session within a 30-minute window. That means if someone visits your site, leaves in 10 minutes, and then comes back 5 minutes later, it's still counted as one session.
Sessions can be found in Google Analytics, under Acquisition Overview:
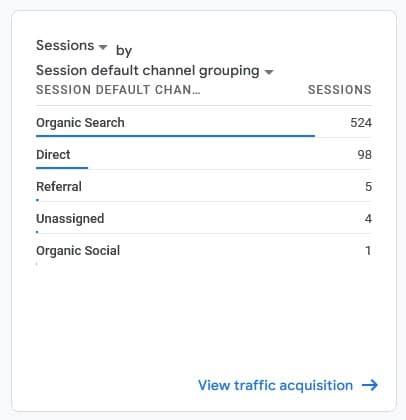
You can improve sessions by running ads to your website or by increasing organic traffic through content marketing.
Using WordPress? Check our article on the best Google Analytics plugins for WordPress.
New users vs returning users
These metrics show the number of new users and returning users you get on your site. They can be found under the Retentions report in GA4.
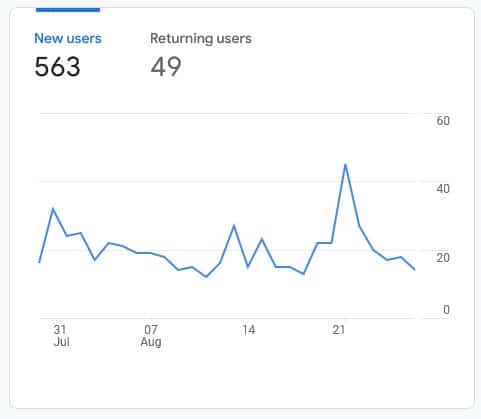
A new user is essentially a visitor who hasn't visited your site before and a returning user is a someone who has.
These metrics can help you establish how valuable your visitors are when running an online shopping cart.
More on Ecommerce metrics later.
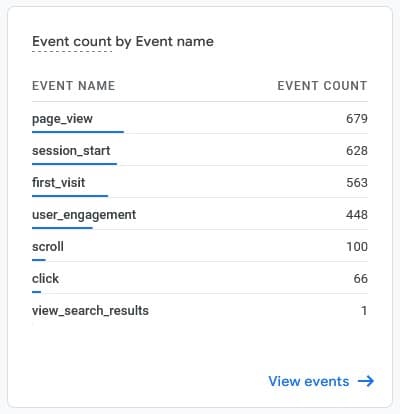
Pageviews
This metric is the number of views a webpage receives in a given timeframe. It's different to sessions because one person can view more than one page per session.
A webpage can be a home page, contact page, or an article on your blog.
When people are talking about website traffic, they are sometimes referring to sessions or pageviews. However, they are quite different.
Pageviews can be tracked in Google Analytics under Engagement Overview and Events:
Pages per session/visit
Pages per session is the average number of pages people view on your website per session in a chosen timeframe.
So if you get 10 sessions in one day by 10 people and each person views 2 pages each, your average pages per session would be 2.
This metric helps you know if people are clicking on multiple pages on your site, either to read more content or learn more about you and your business.
The higher the number, the more engagement you have. A good range to aim for depends on the type of business and content you have.
But an unofficial standard is 2.6 pages per session.
If your average pages per session is low, you can improve it by adding more relevant internal links in articles, improve site navigation, or keep a clean site design.
For more information on performing an internal link audit, we have a full guide here.
Average engagement time
This is the average time people spend on your website over a specific period.
You can also get a breakdown of average time spent per session in GA4 under the Engagement Overview page.
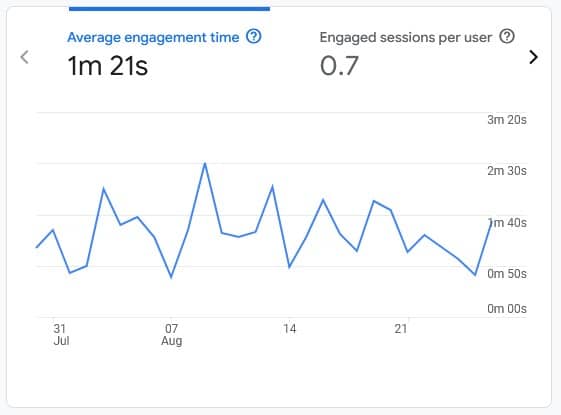
It's calculated per visitor and over the average session duration. This is an important metric because it can tell you whether or not your visitors are sticking around.
If your average engagement time is low, it could mean the pages they land on aren't providing the user with the information they were looking for.
Improving this metric can be done by making each page hyper specific, providing enough valuable content, and having strong keyword intent.
Read our post on Google Analytics for Blogs to learn more.
Engagement Metrics for Ecommerce or Affiliate Sites
Customer satisfaction is essential for any business, including eCommerce brands.
Knowing these metrics will help you gain clarity to maximize business growth.
Revenue

Increased revenue is a clear metric you're doing something right. This is what all businesses want to see in their analytics dashboard.
Measuring it will depend on the platform you're using, most of which can be integrated with Google Analytics.
Looking at this metric directly might not reveal much, but knowing your averages can allow you to drill into contributing factors when things don't look right.
Order Value
Order value is the average amount customers spend per order in your eCommerce store.
Increasing this number will usually increase your overall revenue.
Other than increasing traffic and conversions, here are a few more ways to increase average order value:
- Set an order minimum for free shipping
- Cross promote similar products with upsells and order bumps
- Add lower-priced products that complement your catalog
Increasing order value will usually add more revenue to your business.
Abandonment rate

Abandonment rate tells you the percentage of how many people leave the checkout page without purchasing in a given timeframe.
It's the total number of people who make a purchase divided by the total number of people who visit the checkout page, then turned into a percentage.

The calculation looks like this:
(1 – (100 purchases ÷ 400 checkout visitors)) * 100 = 75%
In the above example, 400 people landed on the checkout page and 100 of them continued with their purchase.
That means that 75% of people didn't abandon the sale.
Knowing this metric helps you better understand how to increase sales at the checkout level.
Many shopping cart platforms will trigger an abandonment cart email sequence when the customer enters their email and then leaves before purchasing.
Conversion rate
The conversion rate in ecommerce is the number of people who buy compared to the total number of traffic to product pages.
So if your online store received 500 visitors last month, and you made 20 sales, your conversion rate would be 4%.
When you monitor this metric, you can identify potential issues people might have when making purchase decisions.
You can improve this number by making your shopping experience more user-friendly.
Click-through rate (CTR)
Click-through rate is the total number of ads or search results that are clicked compared to the number of times they are seen, also known as impressions.
For example: Your Facebook ad is seen 10,000 times and gets clicked 800 times, giving you a CTR of 8%.
Or your Google search results get 50,000 impressions last month and got 6,000 clicks to your website, giving you a CTR of 12%.
Measuring this metric in your ads platform will help you make improvements to the copy in your ads or make changes to your offer.
And keeping track of your search traffic, CTR will show where to improve the copy in your titles and aiming for higher rankings.
Engagement Metrics for Email Marketing
Email marketing still has the highest ROI out of any other marketing channel.
These are the metrics to look out for when improving email engagement.
Email sign-ups

Email sign-ups are the total number of email subscribers you gained in a certain timeframe, usually tracked monthly.
It's an essential metric to monitor if you want to grow your email list and revenue.
Email marketing services like Flodesk or ConvertKit keep track of this metric for you, with percentage stats on increases and declines.
To grow email sign-ups, you can offer a lead magnet, add a popup to WordPress, or reposition opt-in forms.
Also, check our post on how to build an email list from YouTube.
Form impressions
This metric can be found in some email opt-in plugins such as OptinCat and Sumo. It shows the number of times an opt-in form is seen in the browser. OptinMonster of course includes this with all of their packages as well!
It can be very useful because it can help you locate optimal areas to place opt-in forms on your site.
For example, let's say you have an opt-in form in the sidebar and you're getting lots of sign-ups. Maybe your form impressions are disproportionately high and it would make sense to place the form somewhere else.
Trying different locations could result in more of your visitors seeing it and getting even more subscribers than before.
Open rate
Email open rate is the percentage of your email subscribers who open your emails.
All email marketing services, like ConvertKit, will share this number so you can make improvements to your email campaigns.
A low open rate could mean that people aren't getting your emails in their inbox or the subject lines aren't attracting clicks.
Improving email deliverability and testing your subject lines are effective ways to improve your open rates.
Email CTR
Email CTR is the percentage of subscribers who click links inside the emails you send them.
If you get a decent open rate but a low email CTR, then knowing this number can help you resolve the issue.
It could be the copy in the email isn't engaging enough, or that you don't have enough links, or that your call to action isn't clear enough.
Either way, this metric can direct you to testing different things in your emails to see what gets more clicks.
Engagement Metrics for Social Media
Social media engagement metrics are an integral part of business growth through social media marketing.
Here are the metrics you want to keep a close eye on.
Reach

Reach on social media is the amount of times your content is viewed. You can see your total reach in your analytics dashboard or for each individual post.
Tracking this metric will help you understand what types of content people are consuming, what they're interested in, or which types the algorithms are favoring (see also our full guide to content metrics).
It's a good idea to create similar content that is doing well to see if they propel growth.
Impressions
Impressions on social channels are the total number of times your content gets seen in feeds or elsewhere, even if it isn't clicked on.
This number will almost always be higher than reach because not everyone who scrolls past your content will click on it.
Monitoring your impressions helps you know if your content is grabbing people's attention enough or if you need to write more interesting captions.
Engagement rate
This is quite an important social media metric and one that will help grow your socials the most.
It's how many times people interact with your content, so likes, saves, comments, or shares, etc.
The more content engagement you get, the more it gets favored by the algorithms. That's because the platforms want people to stick around for as long as possible.
When you know which content performs the best, you're able to give your audience what they want.
Video watch time or completion rate
Watch time is the number of minutes and hours your videos have been watched over a specified time period.
Completion rate, on the other hand is the percentage of viewers who watch your videos to the very end.
Both provide you with great insights into the quality and engagement of your videos.
The more time your audience spends watching your videos, the more you'll build a relationship with them and the more you'll grow your social media channels.
Customer engagement metrics
A customer engagement metric will help you further understand the relationship between how your customers engage with your marketing strategies.
Customer Satisfaction Score (CSAT)
This metric is a key performance indicator of how satisfied customers are with a company's products and services.
A Customer Satisfaction Score can be obtained by asking customers a simple question, "How satisfied are you with your overall experience of your product?" and getting them to rate it out of 5 or 10.
The CSAT score is then calculated by taking the positive responses and dividing them by the total number of responses, and multiplied by 100, giving a percentage.
For example, if you receive 100 total responses and 65 were positive, your CSAT score would be 65%.
The metric is a great indicator of customer experience, which can be collected on your website or in email campaigns.
Net Promoter Score (NPS)
Net Promoter Score or NPS is like Customer Satisfaction Score, but is calculated differently and measures customer loyalty.
Customers are given a simple question such as, "How likely are you to recommend [Product/Service] to a friend or colleague?", in which they can score between 1 and 10.
Respondents are then put into one of three categories:
- Promoters: People who scored 9 - 10
- Passives: People who scored 7 - 8
- Detractors: People who scored 1 - 6
Then the percentage of detractors is subtracted from the percentage of promotors to get the final score.
For example, if 55% were promoters, 40% were passives, and 5% were detractors, the total score would be 50%.
The range can be between -100 and +100 and the higher the number, the better.
Conclusion
That concludes this post on the most important engagement metrics you need to know about.
Staying ahead of these metrics will give you a huge advantage when focusing on business growth.
To learn more about improving these numbers read our post on how to increase blog traffic.
Related Posts


Want to learn step-by-step how I built my Niche Site Empire up to a full-time income?
Yes! I Love to Learn
Learn How I Built My Niche Site Empire to a Full-time Income
- How to Pick the Right Keywords at the START, and avoid the losers
- How to Scale and Outsource 90% of the Work, Allowing Your Empire to GROW Without You
- How to Build a Site That Gets REAL TRAFFIC FROM GOOGLE (every. single. day.)
- Subscribe to the Niche Pursuits Newsletter delivered with value 3X per week
My top recommendations